IEEE Talks Big Data: Mahmoud Daneshmand & Ken Lutz
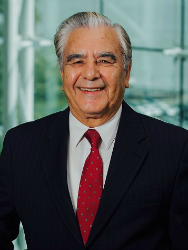
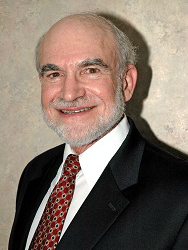
Dr. Mahmoud Daneshmand is a member of the IEEE Big Data Initiative (BDI) Steering Committee, Co-Founder and Chair of Steering Committee of the IEEE Internet of Things (IoT) Journal, and Professor of Business Intelligence & Analytics at Stevens Institute of Technology. Dr. Kenneth J. Lutz is an IEEE Life Senior Member and an adjunct professor at the University of Delaware, where he teaches Smart Grid courses. The two men recently participated in a joint interview to frame some of the issues raised by Big Data and data analytics in the context of the Smart Grid.
Question: Would each of you take a turn describing how we should frame a discussion on Big Data and analytics in the Smart Grid era?
Mahmoud Daneshmand: We should frame the discussion by considering the roles and responsibilities of four stakeholders: producers, distributors, consumers and regulators. How each of these stakeholders benefit from data analytics may be slightly different. We should also talk about the positive return on investment (ROI) for data analytics-related investment, which has been variously estimated at between 5-to-1 and 11-to-1 – meaning $5 to $11 back for every $1 invested. That’s important because all four stakeholders I just named should benefit from Big Data and analytics. Also, some analytics today should be accomplished in real-time at the edge of the distribution network for efficiency and speed, not at the office. This is also called fog/cloud computing.
Kenneth Lutz: I agree with Mahmoud. Stakeholders would like to know the answer to the question, “So what?” Certainly, framing the discussion in terms of dollar value and ROI makes sense. To expand on Mahmoud’s comment on real-time data analytics, I’d like to add that back-office analytics, such as long-term demand forecasting, will also continue to play a crucial role, and much of a utility’s real-time data can be used for back-office analytics. For example, utilities spend millions of dollars planning their capital expenses over the course of several years to determine where they need new facilities, and real-time data can contribute to these analyses.
Question: Mahmoud, you mentioned data analytics at the edge of the network. How do you define “the edge” and how do data analytics play a role at the edge?
Daneshmand: The edge means at the sensor level, at the edge of the network where the data is generated. It is also called fog computing. Fog enables computing anywhere along the cloud-to-thing (device) continuum. There’s a saying in edge/fog computing that rather than taking data to the analytics, take the analytics to the data – meaning the point at which the data is being generated. Simple computations at the processor level at the edge can relieve data traffic on a communication network backbone and lighten the burden of centralized analytics. In a simple demand response scenario, an algorithm could alter the settings for a home heating or cooling system in response to a signal on grid conditions, the time of day or outdoor temperatures.
Lutz: I’d expand on that notion by pointing out that because the smart grid is characterized by many interconnections, we will need data from different sensors throughout the grid, including substations and distribution points that may affect what goes on at the edge. So unless you have the big picture of what’s occurring across the grid, automated processing at the edge could lead to making wrong decisions. I think that referencing “the edge” could be misleading. There probably are several edges. For example, we can define “the edge” as located at the customer interface. But on the customer interface side there could be an entire microgrid, which has its own edges. Within a microgrid you have to replicate many of the decisions you’re making in the distribution grid. So “the edge” premise gets complicated quite rapidly.
In terms of Mahmoud’s four stakeholders, it may be insightful to note that they can each act independently. On a hot summer day, the generators would benefit by producing more power, but eventually they’re going to reach their limits and will have to call on consumers to cut back demand. So one aspect of Big Data analytics will be to create a comprehensive view of what’s going on across the grid, mash it together, and decide on the right type of controls that we need for the grid, wherever controls have to be exercised.
The overriding goal is to obtain data from all of the grid’s systems, analyze the data, and then figure out how to use those insights to keep the grid stable and reliable, and how we're going to keep power quality high. While the four types of stakeholders may want to act independently, the use of Big Data analytics will expose stakeholder dependencies. We can use Big Data to develop incentives that will reward the stakeholders for keeping the grid stable and reliable.
Question: Ken, would you provide an example of data-driven development and use of advanced controls?
Lutz: Phasor measurement units (PMUs) were invented in 1988. Today there are roughly 1,700 PMUs deployed in North America and most of them are in transmission lines, although some are beginning to be deployed in distribution grids. But for a technology that’s almost 30 years old, there hasn’t been a lot of data analytics that have led to a lot of control systems based on what the PMUs show. Utilities of course do use the analyzed data to exercise controls, but it seems to me that after 30 years we should be much further along. PMUs are only sensors, not control systems. So in my view it’s really time for the utilities to launch into a Big Data initiative, figure out what all of these sensors tell us, and determine how to better control the grid.
In fact, I would even propose working the problem backwards. Over the past few years we’ve focused on sensors – smart meters, PMUs and so on. Maybe we ought to ask ourselves, “What kind of control systems do we need to produce reliable, quality power?” Once we figure that out, then we can ask, “What kind of data analytics do we need to manage these control systems properly?” And when we can figure that out, then we can ask ourselves, “What kind of sensors do we need in the grid to provide the data for those analytics?”
Question: If your contrasting approaches to Big Data, analytics and the grid are representative, it would appear that the power industry’s approaches to Big Data are far from settled. Are there any fundamentals to Big Data that haven’t changed from past information technology (IT) practices?
Daneshmand: The perennial IT challenge is to identify relevant data, access that data, clean that data, organize and aggregate that data and then process and analyze it to achieve actionable operations and business intelligence. So traditional IT practices remain relevant. One of the challenges is that, in terms of Smart Grid – as Ken pointed out – our notion of relevant data remains dynamic and, in fact, that may continue to change. Also, as the name implies, Big Data, as well as the IoT, introduces the dimension of scale, which at least for utilities is a new challenge. And we haven’t even touched on issues such as cybersecurity, data privacy and intellectual property ownership.
 |
Dr. Mahmoud Daneshmand is a member of the IEEE Big Data Initiative (BDI) Steering Committee, Co-Founder and Chair of Steering Committee of the IEEE Internet of Things (IoT) Journal, and Professor of Business Intelligence & Analytics at Stevens Institute of Technology. |
 |
Dr. Kenneth J. Lutz is an IEEE Life Senior Member and an adjunct professor at the University of Delaware, where he teaches Smart Grid courses. |